Skip to main content
Home
About us
Resource centre
Newsroom
Services
Jobs
Latest tenders
Search GCIS.gov.za
Search
Breadcrumb
Home
>
About us
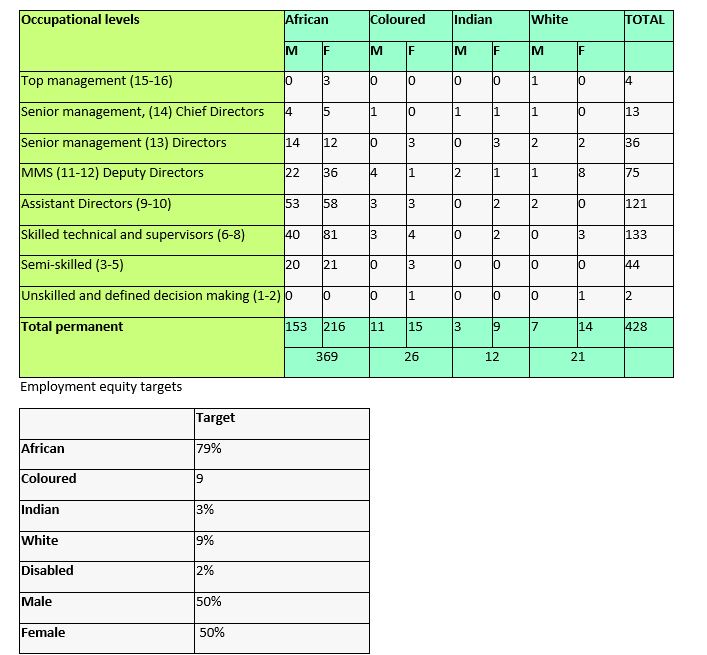
Representivity
Racial and gender composition as at September 2022
Empowering South Africans through communication excellence.